



75% faster report delivery with AI-powered BI for Synsel
Synsel is a Netherlands staffing agency that places technical candidates (such as mechanics and engineers) across roughly 2,500 industrial partner companies. Its team of around 80 is built around sales consultants, who learn each candidate's skills and preferences and match them to the right company.
Agency work generates massive amounts of data across marketing, sales, and finance. Synsel uses it to decide which channels to invest in, when to grow the sales team, and where to take the business next. That data already flowed into a warehouse, but the pipeline behind it was fragile, and every new dashboard still meant weeks of manual analysis.
DigitalSuits rebuilt the pipeline on solid ground, replaced that analysis with an AI-driven query-generation workflow, and cut dashboard delivery from over a month down to about a week.
Client
Country
Netherlands
Industry
Partnership period
February 2023 – now
Team
Fractional CTO, Product Owner, Data Engineer, QA Engineer
Services
Generative AI integration, Data engineering, Custom software development, DevOps




Long BI cycles, slower business decisions
Synsel's data flowed from their four core systems into a cloud warehouse, with a third-party BI tool on top as the dashboard layer.
Synsel's goal was to optimize the BI process and get new dashboards with the metrics they needed faster. Getting there meant solving four problems.
- New dashboards took too long and required an outside consultant. Each one was built from scratch manually, from mapping the data to writing the queries, so new requests kept coming in faster than they could be delivered.
- The pipeline needed a stronger foundation. The integration ran on raw Cloud Functions with nothing orchestrating it, so failures went unnoticed and no one could trace what happened to data along the way. Rebuilding it properly looked like another long project.
- Key sources had no ready-made connectors. Synsel's niche Dutch tools had no ready way to feed a cloud warehouse, so every new source meant building an integration from scratch.
- A third-party customer data platform priced by volume. CDP cost scaled directly with data volume, so every bit of business growth made it more expensive.
Put together: the data itself was fine, but almost every layer around it was fragile, manual, or getting more expensive.
"They have really strong commitment and leadership, in budget delivery. They understood staffing, not just delivered generic automation and were clear about what AI could and couldn't do (and how much it might cost us to run it). Good value for the scope of work"
 Marco KoersCEO, Synsel Techniek
An AI-powered system to handle the whole data flow
We rebuilt almost every piece of the old setup, from how data arrives to how dashboards get made. Here's what our journey looked like:
Designing the new architecture before the rebuild
The DigitalSuits team designed the target architecture, with every change mapped to a specific bottleneck:
- We kept what was working: the existing warehouse stays as the single source of truth
- One managed pipeline layer replaced standalone scripts
- The legacy ATS was replaced with one that can actually feed a warehouse
- The third-party CDP was retired, with its tracking rebuilt through analytics and ads connectors feeding the existing warehouse
- Every key source system were connected through a reliable, standardized integration
- AI took over query writing, with a data engineer reviewing the output
- Internal dashboards replaced a separate BI tool
- Security, monitoring, and cost control are built in from day one
Putting the pipelines under one orchestrator
We rebuilt the pipelines on Google Cloud's managed data services, so every data flow now follows the same standard: pull the data from its source, bring it into a consistent format, and load it into the warehouse, with an optional enrichment step when extra context is needed. Each pipeline runs on schedule, recovers from failures on its own, and keeps a full record of every run.
The rebuild took about two months and a half, well ahead of what the client expected for a project of this scope. And since every pipeline follows one pattern, connecting a new data source is now a quick, predictable job rather than a new project.
AI took over the slowest step
We implemented GenAI to handle the part of the process that used to eat the most time – generating reports based on custom requirements.
When a stakeholder needs a new dashboard, they come with a rough idea of what they want to see. From there, an AI model does the work that used to fall to an outside data consultant, turning that request into a dashboard logic. A DigitalSuits data engineer reviews the output and ships it into the code.
The visualization is now built into the sales-automation platform DigitalSuits had earlier developed for Synsel, so dashboards ship as part of that product rather than being assembled in a third-party BI tool.
As a result, stakeholders now get a fixed dashboard, with filters and any data they need, much faster, without hiring a consultant for the analysis or depending on a BI tool for the visualization.
Replacing the legacy ATS
Our team migrated Synsel from the obsolete ATS to a new one that connects properly to the new data flow. As this system holds the core recruitment data, it feeds almost every dashboard.
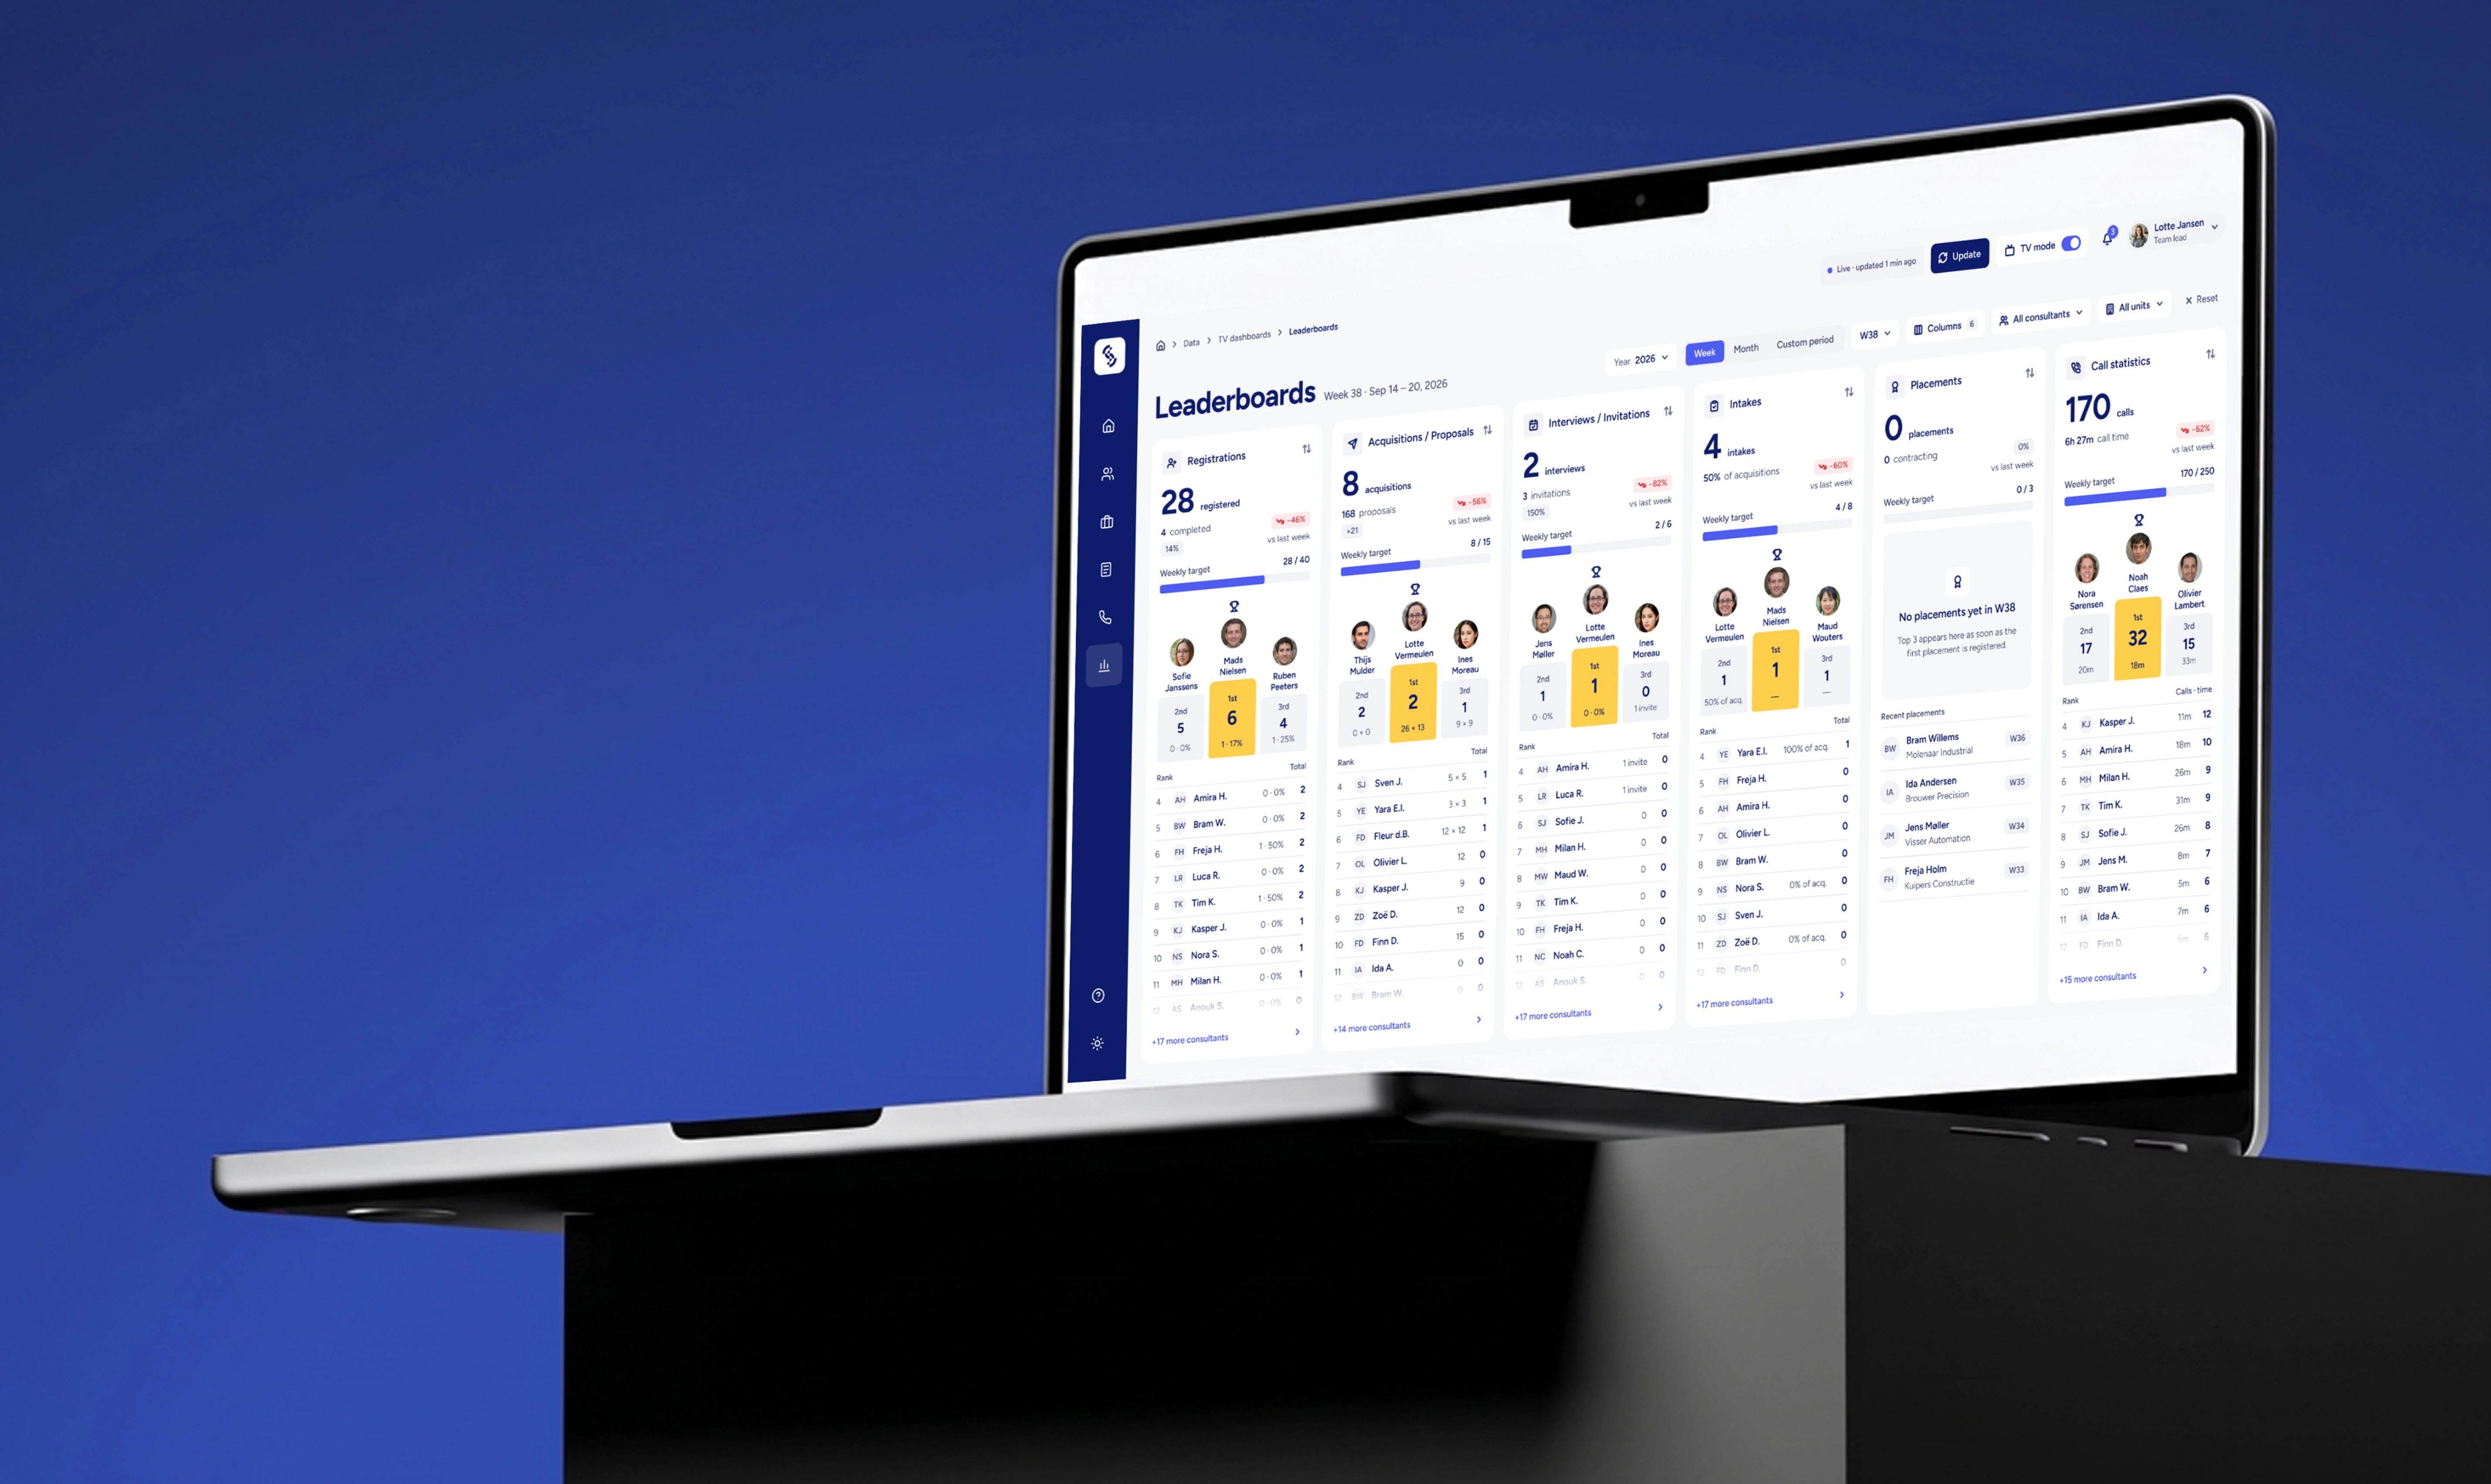
The clearest example of how this data is used is the consultant leaderboard, which tracks each consultant's progress through the stages of a placement and shows how many candidates they moved through that week.
Connecting the finance system
Synsel used a local Dutch finance system. It held the money side of the business: what each placement earned, its margin, and gross revenue.
It had no ready-made route into a cloud warehouse, so our engineers built a custom integration directly against the vendor's API and turned it into a fully managed pipeline.
Combined with recruitment data, it now powers some of Synsel's most-used dashboards:
- Consultant performance, which shows each consultant's contribution to the business. It was the first dashboard we moved off the old BI tool, since the team relies on it every month.
- Revenue trends, which compares each reporting period with the same one in previous years, giving leadership a clear view of how the business is developing.
Retiring the customer data platform
The 3rd-party customer data platform was one of the largest line items in Synsel's data stack. With the AI-powered sales automation we'd built for Synsel alongside this project, the company needed a tracking setup it could fully own. So we moved tracking entirely into a properly configured analytics setup, feeding straight into the warehouse, getting the same insight, without the platform fee or the ad spend on top.
That data now powers a Funnel Operations dashboard that puts every acquisition channel side by side, showing what each one costs against what it actually delivers. Synsel can now see at a glance where its budget works hardest.
Running the cloud infrastructure safely
The whole setup lives in Google Cloud, and we built it from scratch with access permissions and encryption in place, so every connection inside the system is locked down.
It also had to handle heavy load from day one. The pipelines pull data from the source systems every few minutes, sometimes in large volumes, so the setup was sized to carry that traffic comfortably.
Three things are watched continuously:
- Load. We get an alert if the machines processing the pipelines cross a resource threshold, before anything slows down.
- Failures. A failed pipeline retries on its own and sends an alert to Slack and email, so nothing breaks quietly.
- Cost. BigQuery charges for storing data and for every query run against it, so we track what each dashboard actually costs and tune the queries behind it to keep the bill down.
Scalable BI with no consultant in the loop
DigitalSuits can now deliver new dashboards faster than Synsel can put them to use. The AI-powered BI setup covers the entire reporting flow, minimizes errors, and lets Synsel scale analytics without adding new hires. We also rebuilt and connected the systems feeding the data warehouse, turning them into one intelligent analytics ecosystem that works directly within Synsel's day-to-day operations.And here's what changed, in numbers:
1 month → 1 week
Per-dashboard delivery time, from request to live dashboard.
5x faster data analysis
AI handles both the analysis and the queries.
10+ dashboards live
With more in progress, clearing a backlog.
~€50K/year saved
The CDP is gone, with its tracking rebuilt inside the existing analytics setup.